- >
- Demos
- >
- >
- Granulometry: Distribution of Pore Diameter
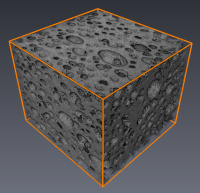
This image was generated by microtomography. It represents foam that consists of material and pores.
This demo illustrates the use of automatic segmentation to extract pores from a 3D foam image and generation of histograms of physical quantities.

Tomographic image visualized with Volume Rendering.

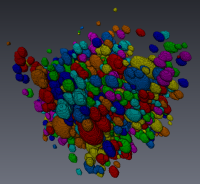
Result of the pore segmentation using an
Interactive Thresholding module, a
combination of Dilation/Erosion modules to remove small spots, and a
Labeling module to separate pores. Lastly, a Border Kill module is used to remove
pores on the edge of the image because computing quantities like their volume or diameter is not meaningful.

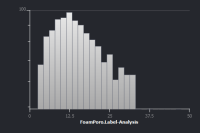
This example computes the diameter of each segmented pore using a Label Analysis module, then represents the distribution of diameters in a Histogram.
Histogram of Diameter Distribution

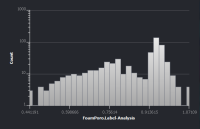
This example computes the sphericity (which is a custom measure) of each segmented pore using a Label Analysis module, then represents the distribution of sphericity in a Histogram.
Histogram of Sphericity Distribution