
- >
- Demos
- >
- >
- Foam Analysis: Measure Volume of Pores
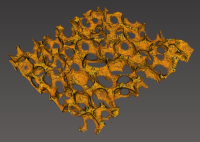
Tomographic image visualized with Volume Rendering.
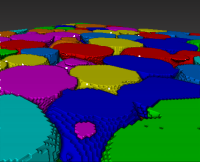
Result of the pore segmentation using an
Interactive Thresholding module, a
Separate Objects module, and a
Labeling module.
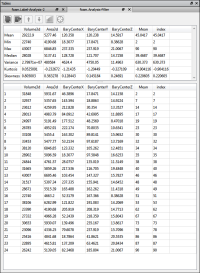
This example computes the volume, the area, and the centroid of each segmented pore using a Label Analysis module. It enables interaction between the Viewer and the Table Panel Spreadsheet in order to locate each pore. Clicking on a region in the 3D Viewer causes the corresponding item in the Table Panel Spreadsheet to be highlighted. Likewise, clicking on an item in the Table Panel Spreadsheet moves the dragger in the 3D viewer to the corresponding position. Note that in the analysis only the 24 widest pores were retained using the Analysis Filter module.
Volume Rendering of widest pores and Analysis Spreadsheet