- >
- Demos
- >
- >
- Multi Component Analysis
In biomedical imaging it is sometimes required to measure and quantify multiple objects such as cells, vesicles, or puncta. The project scripts on this page demonstrate how such an analysis can be performed. A tutorial explaining how these projects are generated is available here.
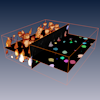
The data we show here are cell bodies of neurons from the rat cortex imaged with a confocal microscope. The data are kindly provided by Marcel Oberlaender and Bernd Sakmann, Max Planck Florida Institute.
The first project demonstrates how to get a binary segmentation of the cell bodies, separate clusters of cell bodies and label them individually. For binary segmentation the Local Thresholding module is employed. Separation and labeling is done with the Hierarchical Watershed module.
Besides basic measurements of volume and position, the sample of cell bodies can be analysed with respect to local density. This requires the cell bodies be represented as a point cloud or Point Cloud. Using module Point Cloud Density the local density of cells can be calculated for each node of the point cloud and visualized false color coded.
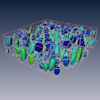
With module Label Analysis it is possible to extract shape parameters from the labeled regions. The extracted parameters are nicely visualized with ellipsoids using module Tensor View.
This project shows how to filter a spreadsheet object and how the filtered spreadsheet may be used to extract a filtered version of the label image. The result of the filter operation is viszualized with the surface recontruction of the filterd label image. Adjust the range of the histogram sliders shown in the Properties area and wait a little bit until the project has updated.
Surface reconstruction of filtered label image