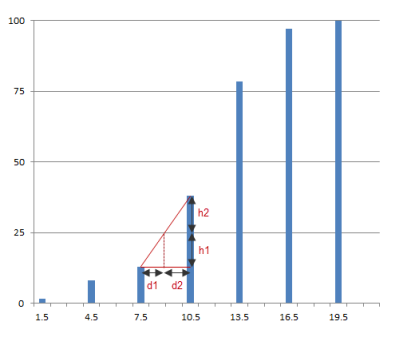
| Figure 1: Histogram quantile interpolation |
Such a quantile value is computed by interpolation between the first bin where the cumulative histogram is higher than the percentage of observations and its previous bin.
The cumulative histogram is given at the center of each bin, counting the half
population of the current bin. For instance with a bin size of 1, the cumulative
histogram for the bin 3.. 4 is computed adding the total population of the values 0,
1 and 2 to the half population of the value 3. It is assigned to the bin center 3.5.
| Figure 1: Histogram quantile interpolation |
With the example above, where the bin size is 3, the 25