Display a MATLAB Plot in a Java Application
Purpose
The purpose of the example is to show you how to do the following:
Use the MATLAB® Compiler SDK™ product to convert a MATLAB function (
drawplot.m) to a method of a Java® class (plotter) and wrap the class in a Java pacakage (plotdemo).Access the MATLAB function in a Java application (
createplot.java) by instantiating theplotterclass and using theMWArrayclass library to handle data conversion.Note: For complete reference information about the
MWArrayclass hierarchy, see thecom.mathworks.toolbox.javabuilderpackage.Build and run the
createplot.javaapplication.
The drawplot.m function displays a plot of
input parameters x and y.
Procedure
If you have not already done so, copy the files for this example as follows:
Copy the following folder that ships with MATLAB to your work folder:
matlabroot\toolbox\javabuilder\Examples\PlotExample
At the MATLAB command prompt,
cdto the newPlotExamplesubfolder in your work folder.
If you have not already done so, set the environment variables that are required on a development machine. See Configure Your Java Environment.
Write the
drawplot.mfunction as you would any MATLAB function.The following code defines the
drawplot.mfunction:function drawplot(x,y) plot(x,y);
This code is already in your work folder in
PlotExample\PlotDemoComp\drawplot.m.While in MATLAB, issue the following command to open the Library Compiler app:
libraryCompiler
You create a Java package by using the Library Compiler app to build a Java class that wraps around your MATLAB code.
To create the Java package the Library Compiler app, use the following information as you work through this example in Compile Java Packages with Library Compiler App:
Project Name plotdemoClass Name plotterFile to compile drawplot.mWrite source code for an application that accesses the MATLAB function.
The sample application for this example is in
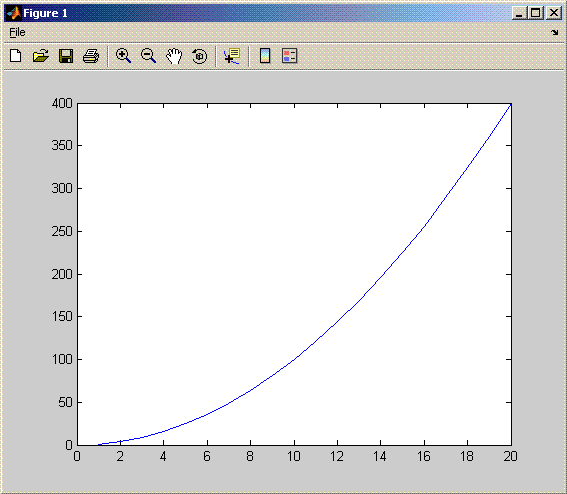
matlabroot\toolbox\javabuilder\Examples\PlotExample\PlotDemoJavaApp\createplot.javaThe program graphs a simple parabola from the equation y = x2 .
The program listing is shown here.
The program does the following:
Creates two arrays of double values, using
MWNumericArrayto represent the data needed to plot the equation.Instantiates the
plotterclass asthePlotobject, as shown:thePlot = new plotter();
Calls the
drawplotmethod to plot the equation using the MATLABplotfunction, as shown:thePlot.drawplot(x,y);
Uses a
try-catchblock to catch and handle any exceptions.
Compile the
createplotapplication usingjavac. When entering this command, ensure there are no spaces between path names in thematlabrootjavabuilder.jar;and.\distrib\plotdemo.jarin the following example.cdto your work folder. Ensurecreateplot.javais in your work folderOn Windows®, execute this command:
javac -classpath .;
matlabroot\toolbox\javabuilder\jar\javabuilder.jar; .\distrib\plotdemo.jar createplot.javaOn UNIX®, execute this command:
javac -classpath
  .:matlabroot/toolbox/javabuilder/jar/javabuilder.jar:
  ./distrib/plotdemo.jar createplot.java
Run the application.
To run the
createplot.classfile, do one of the following:On Windows, type:
java -classpath
  .;matlabroot\toolbox\javabuilder\jar\javabuilder.jar;
  .\distrib\plotdemo.jar
  createplot
On UNIX, type:
java -classpath
  .:matlabroot/toolbox/javabuilder/jar/javabuilder.jar:
  ./distrib/plotdemo.jar
   createplot
Note: You should be using the same version of Java that ships with MATLAB. To find out what version of Java MATLAB is running, enter the following MATLAB command:
version -java
Caution MathWorks only supports the Oracle® JDK™ and JRE™. A certain measure of cross-version compatibility resides in the Oracle software and it may be possible to run applications with compiled MATLAB functions with non-Oracle JDKs under some circumstances—however, compatibility is not guaranteed.
Note: If you are running on the Mac 64-bit platform, you must add the
-d64flag in the Java command. See Limitations of the MATLAB Compiler SDK Java Target for more specific information.The
createplotprogram should display the output.