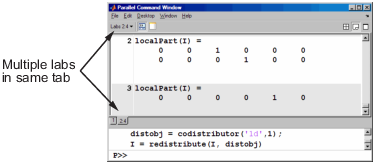
Parallel Command Window
When you start pmode on your local client machine with the command
pmode start local 4
four workers start on your local machine and a communicating job is created to run on them. The first time you run pmode with these options, you get a tiled display of the four workers.
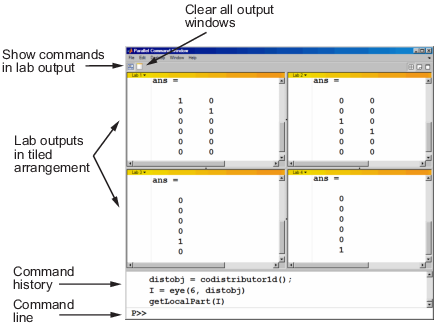
The Parallel Command Window offers much of the same functionality as the MATLAB® desktop, including command line, output, and command history.
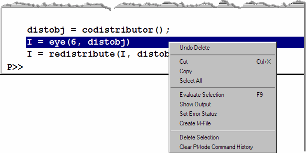
When you select one or more lines in the command history and right-click, you see the following context menu.
You have several options for how to arrange the tiles showing your worker outputs. Usually, you will choose an arrangement that depends on the format of your data. For example, the data displayed until this point in this section, as in the previous figure, is distributed by columns. It might be convenient to arrange the tiles side by side.
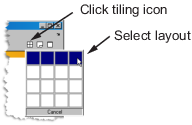
This arrangement results in the following figure, which might be more convenient for viewing data distributed by columns.
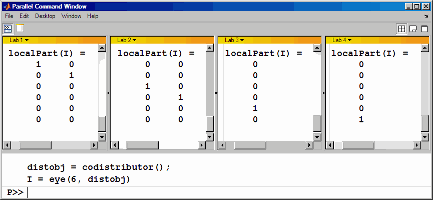
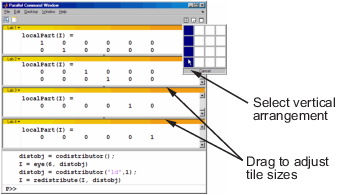
Alternatively, if the data is distributed by rows, you might want to stack the worker tiles vertically. For the following figure, the data is reformatted with the command
P>> distobj = codistributor('1d',1);
P>> I = redistribute(I, distobj)
When you rearrange the tiles, you see the following.
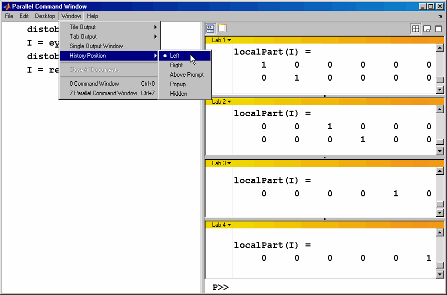
You can control the relative positions of the command window and the worker output. The following figure shows how to set the output to display beside the input, rather than above it.
You can choose to view the worker outputs by tabs.
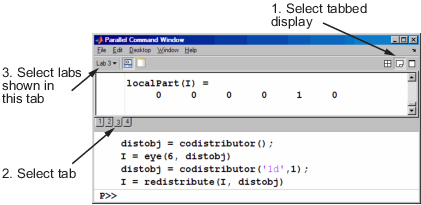
You can have multiple workers send their output to the same tile or tab. This allows you to have fewer tiles or tabs than workers.
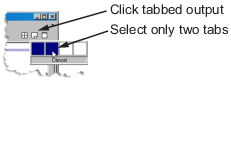
In this case, the window provides shading to help distinguish the outputs from the various workers.
