Create Subplots Using Plot Tools
This example shows how to create a figure with multiple graphs interactively and add different types of plots to each graph using the plot tools.
Create Simple Line Plot and Open Plot Tools
Define variables x and y in
the Command Window and create a line plot using the plot function.
Open the plot tools using the plottools command
or by clicking the Show Plot Tools icon ![]() in the figure window.
in the figure window.
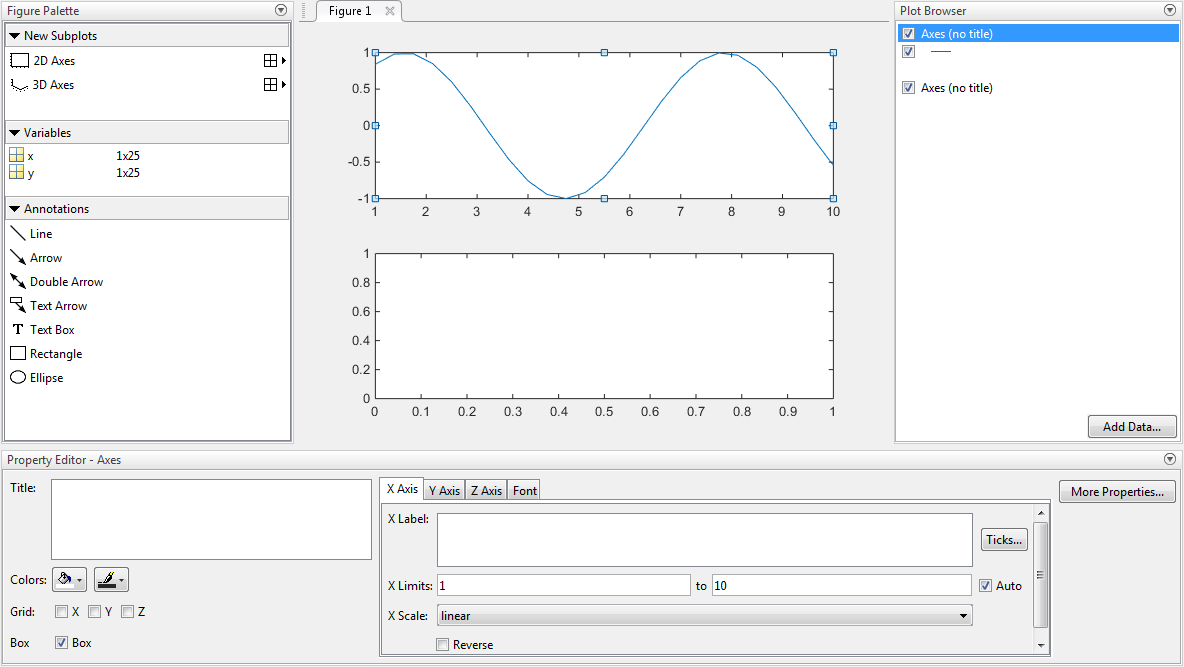
x = linspace(1,10,25);
y = sin(x);
plot(x,y)
plottools
MATLAB® creates a plot of y versus x and
opens the plot tools.
Create Upper and Lower Subplots
Create upper and lower subplots using the Figure Palette panel
in the plot tools. Choose a subplot layout for two horizontal graphs
using the 2-D grid icon ![]() .
.
Add Data to Lower Subplot
Create a scatter plot of y versus x in
the lower subplot using the Figure Palette.
Click the lower subplot axes to make it the current axes.
Select
xandyin the Variables panel of the Figure Palette. Select multiple variables using Ctrl + click.Right-click one of the variables to display a context menu containing a list of possible plot types based on the variables selected.
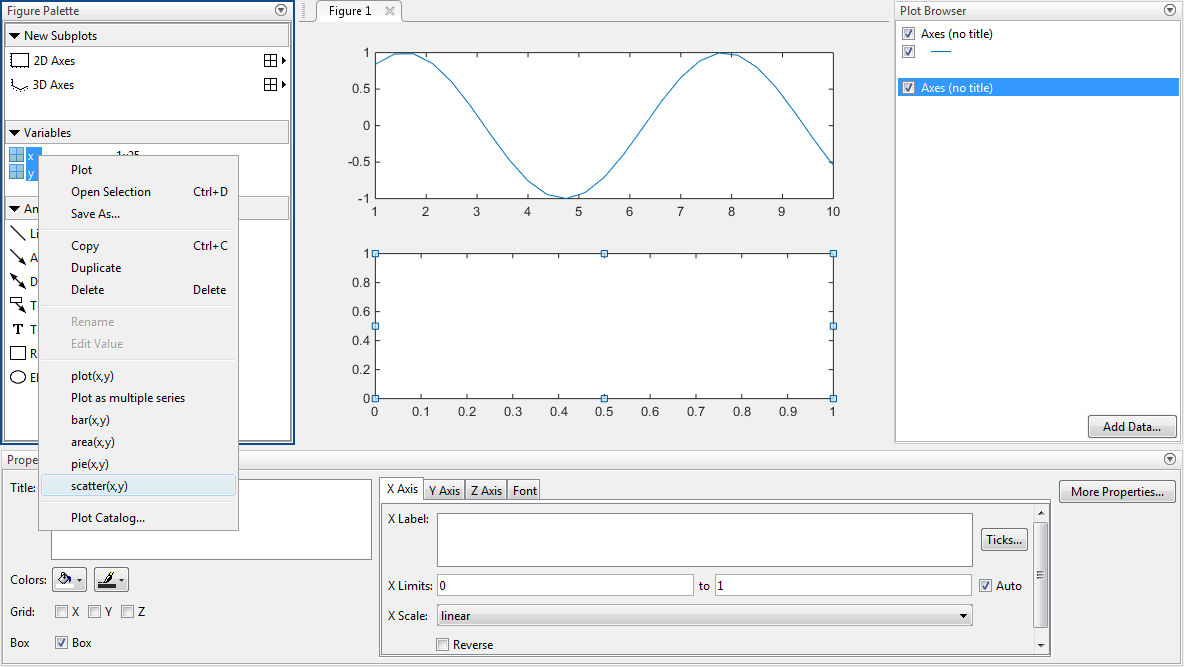
Select
scatter(x,y)from the menu. (The Plot Catalog menu option lists additional plot types.)
MATLAB creates a scatter plot in the lower subplot and displays the commands used to create the plot in the Command Window.
scatter(x,y)
Note
Adding a plot to an axes using the Variables panel overwrites existing plots in that axes.
Add New Plot Without Overwriting Existing Plot
Add a bar graph of cos(x) versus x to
the upper subplot without erasing the existing line plot. Use the Add
Data option in the Plot Browser.
Open a dialog box by clicking the upper subplot, and then click the Add Data button at the bottom of the Plot Browser.
Use the drop-down menu to select a bar graph as the plot type.
Specify the variables to plot by setting the X Data Source and Y Data Source fields. Use the drop-down menu to specify X Data Source as the variable
x. Sincecos(x)is not defined as a variable, type this expression into the empty field next to Y Data Source.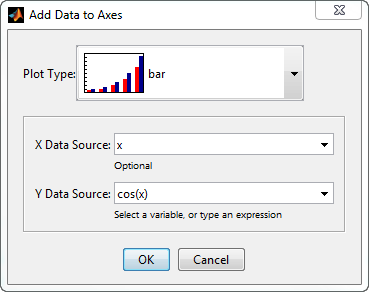
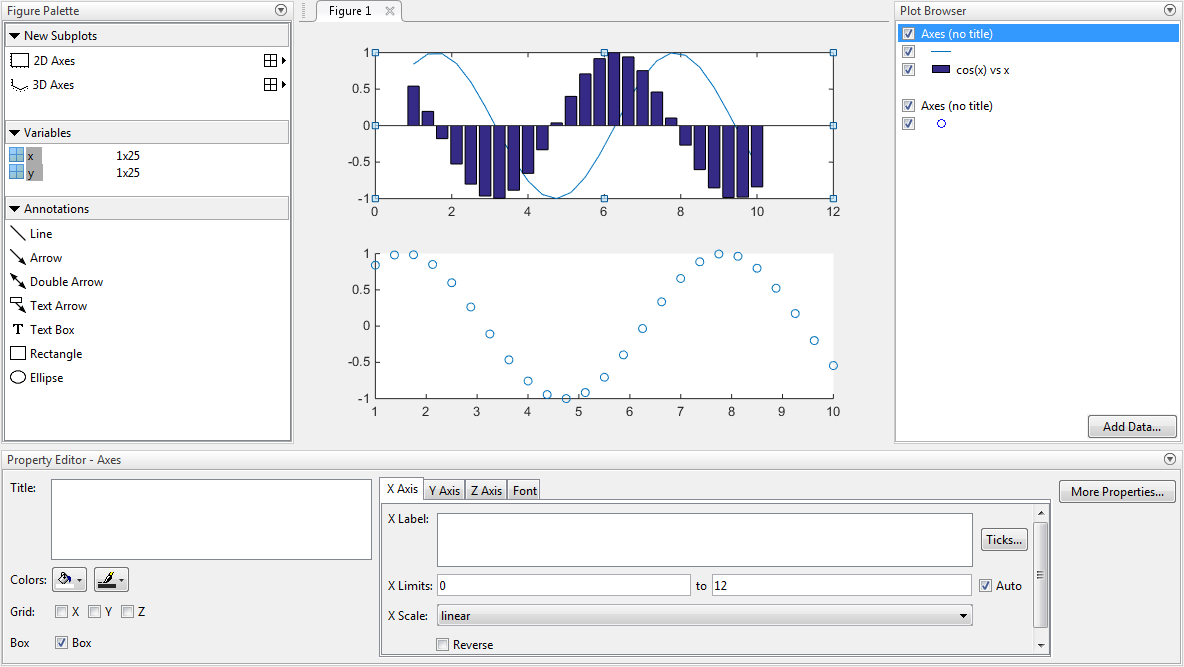
Click OK. MATLAB adds a bar graph to the upper subplot.
See Also
bar | figurepalette | plot | plottools | propertyeditor | scatter | subplot