Customize Graph Using Plot Tools
To customize a graph interactively you can use the plot tools. The plot tools interface consists of three different panels: the Property Editor, the Plot Browser, and the Figure Palette. Use these panels to add different types of customizations to your graph.
Open Plot Tools
To open the plot tools, use the plottools command
or click the Show Plot Tools icon ![]() in the figure window.
For example, define variables
in the figure window.
For example, define variables x and y in
the Command Window, create a line plot and open the plot tools.
x = linspace(1,10,25);
y = sin(x);
plot(x,y)
plottools
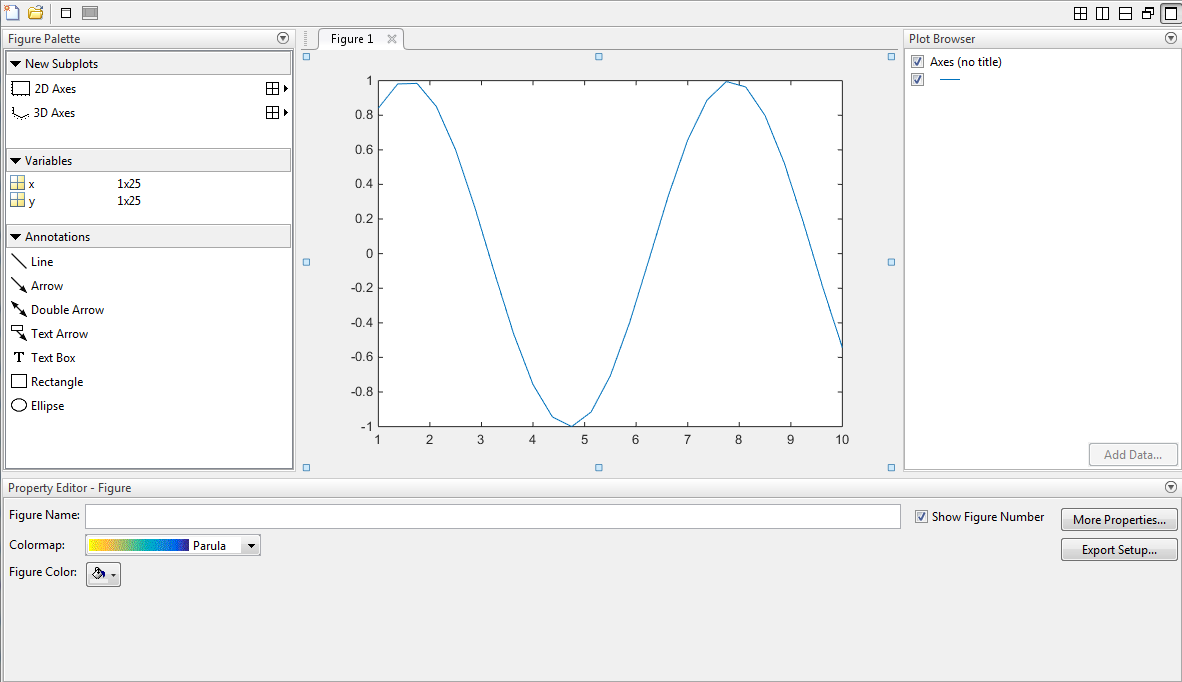
MATLAB® creates a plot of y versus x and
opens the plot tools.
Customize Objects in Graph
To customize objects in your graph, you can set their properties using the Property Editor. For example, click the axes to display a subset of common axes properties in the Property Editor. Specify a title and an x-axis label by typing text in the empty fields.

Click other objects in the graph to display and edit a subset of their common properties in the Property Editor. Access and edit more object properties by clicking More Properties to open the Property Inspector.
Note
You cannot use the Property Editor to access properties of objects
that you cannot click, such as a light or a uicontextmenu. You must
store the object handles and use the inspect command.
Control Visibility of Objects in Graph
To control the visibility of objects in the graph, you can use the Plot Browser. The Plot Browser lists all the axes and plots in the figure. The check box next to each object controls the object's visibility.
Hide an object without deleting it by clearing its box in the Plot Browser.
Delete an object by right-clicking it and selecting Delete.
Add Annotations to Graph
To add annotations to the graph, such as arrows and text, you can use the Annotations panel in the Figure Palette.
Close Plot Tools
To remove the plot tools from the figure, you can use the Hide
Plot Tools icon ![]() , or type
, or type plottools('off') in
the Command Window.
Use the View menu to show or hide specific plot tools panels. If you change the layout of the plot tools, then the layout persists the next time you open the plot tools.
See Also
annotation | figurepalette | inspect | plot | plotbrowser | plottools | propertyeditor