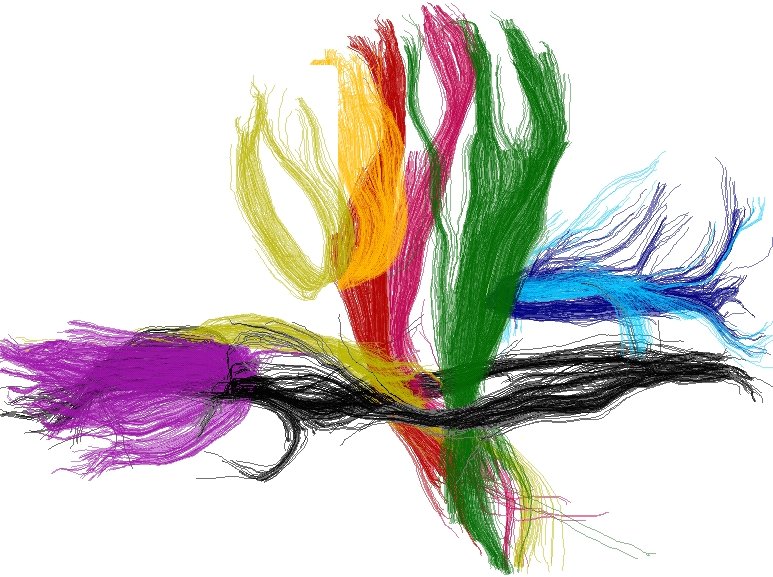
Tracking, reconstruction a analysis of white matter fibers.

Before using this pipeline it is recomended to put your data in a BrainVISA database. See the following process directories for more information :
data management / import / diffusionThere are four subprocesses that can be accessed from this pipeline. They can be used together or individually. Here is a summary of each subprocess purpose :
ROI drawing: With this process you can create or edit a set of region of interest (ROI) with Anatomist 3D ROI drawing tool. This is not really a processing process but it is usefull to have it in the pipeline to benefit from parameters links.
Fiber Tracking: This is the main processing step of fiber analysis : fiber tracking and reconstruction.
Diffusion Bundles Transformation: The Fiber Tracking step produces bundles (i.e. named sets of curves, each curve corresponding to one putative fascicle). It is often necessary to transform bundles into other bundles for example to select only specific fascicles or to apply a referential transformation. This is what this step is for.
Diffusion Bundles Analysis: Once bundles are obtained, they can be visualized in Anatomist but it is also very important to get some quantitative information about the reconstructed fascicle bundles (such as length, fractional anisotropy along the bundle, etc.). This process is dedicated to the extraction of various quantitative information from bundles.
t2_diffusion: T2 Diffusion MR ( entrée )T2 image extracted from diffusion raw data.
raw_dw_diffusion: Raw DW Diffusion MR ( optional, entrée )Diffusion-weighted raw (i.e., non corrected for echoplanar distortions) images.
corrected_dw_diffusion: Corrected DW Diffusion MR ( optional, entrée )Diffusion-weighted images corrected for echoplanar distortions.
starting_points: Tracking regions ( optional, entrée )Set of region of interest (ROI) used to start fiber tracking. Accepts either a BrainVISA/Anatomist ROI graph (*.arg/*.data file extensions) or an image of labels (each label is considered as a single region).
bundles: Fascicles bundles ( sortie )
Toolbox : Diffusion et Tractographie
Niveau d'utilisateur : 0
Identifiant :
DiffusionTrackingPipelineNom de fichier :
brainvisa/toolboxes/connectomist/processes/DiffusionTrackingPipeline.pySupported file formats :
t2_diffusion :GIS image, VIDA image, NIFTI-1 image, MINC image, gz compressed MINC image, DICOM image, TIFF image, XBM image, PBM image, PGM image, BMP image, XPM image, PPM image, gz compressed NIFTI-1 image, TIFF(.tif) image, ECAT i image, PNG image, JPEG image, MNG image, GIF image, SPM image, ECAT v imageraw_dw_diffusion :GIS image, VIDA image, NIFTI-1 image, MINC image, gz compressed MINC image, DICOM image, TIFF image, XBM image, PBM image, PGM image, BMP image, XPM image, PPM image, gz compressed NIFTI-1 image, TIFF(.tif) image, ECAT i image, PNG image, JPEG image, MNG image, GIF image, SPM image, ECAT v imagecorrected_dw_diffusion :GIS image, VIDA image, NIFTI-1 image, MINC image, gz compressed MINC image, DICOM image, TIFF image, XBM image, PBM image, PGM image, BMP image, XPM image, PPM image, gz compressed NIFTI-1 image, TIFF(.tif) image, ECAT i image, PNG image, JPEG image, MNG image, GIF image, SPM image, ECAT v imagestarting_points :GIS image, Z compressed GIS image, gz compressed GIS image, VIDA image, NIFTI-1 image, gz compressed ECAT i image, MINC image, gz compressed MINC image, TIFF image, XBM image, PBM image, PGM image, BMP image, XPM image, PPM image, gz compressed NIFTI-1 image, TIFF(.tif) image, Graph and data, gz compressed VIDA image, Z compressed VIDA image, Z compressed ECAT i image, gz compressed ECAT v image, ECAT i image, Z compressed ECAT v image, PNG image, JPEG image, MNG image, GIF image, Z compressed SPM image, SPM image, gz compressed SPM image, ECAT v imagebundles :Aims bundles