Execute Add-In and Graphical Function
Execute an Add-In to Validate Nongraphical Function Output
If you have built your add-in and COM component using deploytool or mcc and
are ready to begin validating your non-graphical function's output,
see Execute Functions and Create Macros.
Functions Having Multiple Outputs
When working with functions having multiple outputs, simply
define each specific output range with the Argument Properties For y dialog
box. See the Argument Properties
For y step in Function Execution for details.
Execute a Graphical Function
Execute a graphical function on a Microsoft® Excel® spreadsheet by doing the following.
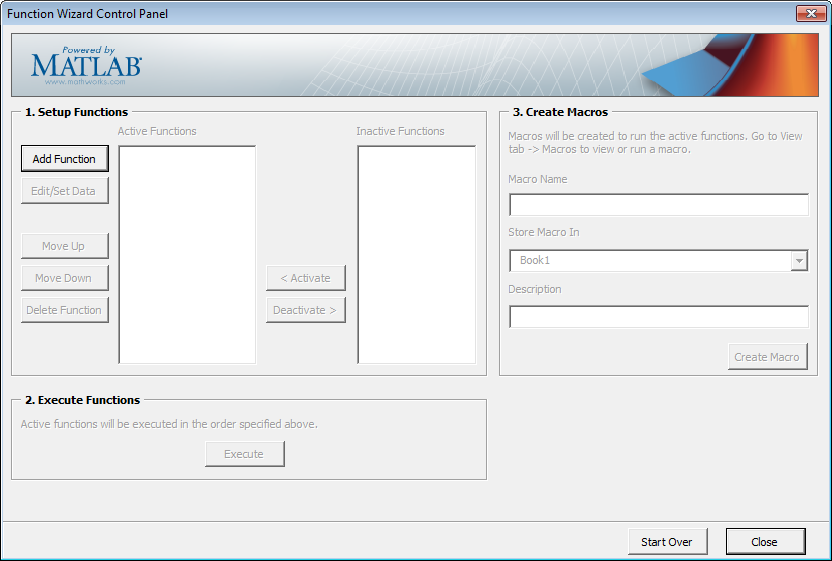
Install and start the Function Wizard using the procedures detailed in Installation of the Function Wizard and Function Wizard Start-Up. Successfully completing each of these procedures causes the Function Wizard Control Panel to display.
Click Add.
Select a function with a graphical output, such as mysurf for example, from the Functions for Class
class_namebox.Click Add. The Function Properties dialog box appears.
Click Done. The Function Wizard Control Panel appears with
mysurfselected in the list of Active Functions.Note: Since
mysurf.mdoes not have any inputs or outputs, there is no need to specify Properties.In the Execute Functions area of the Function Wizard Control Panel, click Execute. The graphical output for
mysurfappears in a separate window.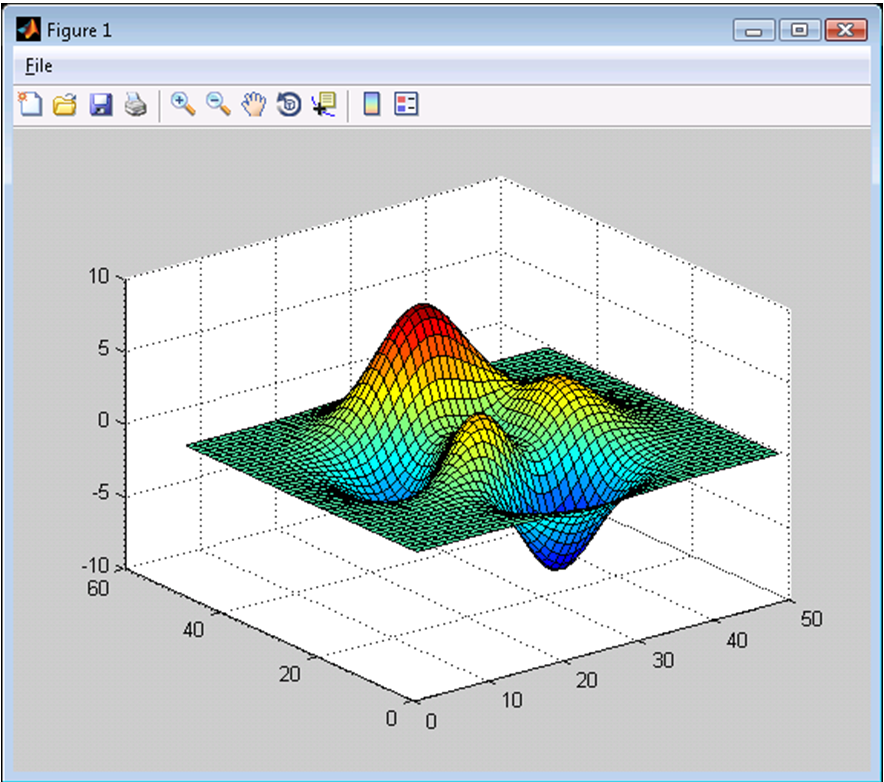
Test to ensure you can interact with the figure and that it is usable.
For example, try dragging the figure window, inserting color bars and legends in the toolbar, and so on.
If you encounter problems working with the figure, consult the person who created it.
Create a Macro Using a Graphical Function
Once you are satisfied your graphical figure is usable, do the following to create a macro to execute it at your convenience.
Caution To create a macro, you must have already built your COM component and add-in with MATLAB® Compiler™. For complete Function Wizard workflows, see Execute Functions and Create Macros and End-to-End Deployment of MATLAB Function. |
In the Function Wizard Control Panel, label the macro by entering
mysurfin the Macro Name field of the Create Macros area.If desired, change the default value Book1 (for the default Excel sheet name) in the Store Macro In field.
Click Create Macro.
See Macro Execution for details on executing macros with different versions of Microsoft Office. When the macro is Run, you should see output similar to the Surf Peaks image in Execute a Graphical Function in this chapter.
Create Dialog Box and Error Message Macros
Create a macro that displays a dialog box using this workflow, which is useful for error message presentation.
Install and start the Function Wizard using the procedures detailed in Installation of the Function Wizard and Function Wizard Start-Up. Successfully completing each of these procedures causes the Function Wizard Control Panel to display.
Click Add. The MATLAB Components dialog box appears.
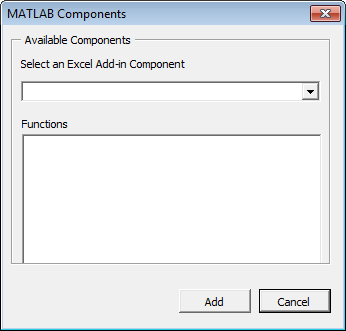
Select a function that displays a graphical error message, such as myerror for example, from the Functions for Class
class_namebox.Click Add. The Function Properties dialog box appears.
Associate an input value of -1 with
myerror.On the Inputs tab, click Properties. The Argument Properties for in dialog box appears.
Select Value and enter
-1.Click Done.
Define the output of
myerror—any Excel spreadsheet cell, in this case.On the Outputs tab, click Properties. The Argument Properties For
xdialog box appears, wherexis the name of the output variable you are defining properties of.Select Range and enter and spreadsheet cell value,
=C13, for example.Click Done. The Function Wizard Control Panel appears with
myerrorselected in the list of Active Functions.Tip If you have functions besides
myerrorlisted in the Active Functions list that you don't want to execute when you testmyerror, deactivate these functions by selecting them and clicking Deactivate.
Click Execute. The following will display.
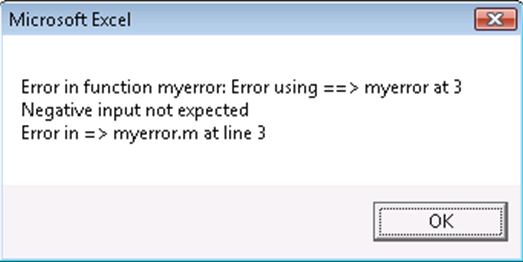
Create a Macro That Displays an Error Message or Dialog Box
Create a macro to display your error message on demand.
In the Function Wizard Control Panel, label the macro by entering
myerrorin the Macro Name field of the Create Macros area.If desired, change the default value Book1 (for the default Excel sheet name) in the Store Macro In field.
Click Create Macro.
See Macro Execution for details on executing macros with different versions of Microsoft Office.